METHOD
In the last decades, with the development of high-throughput sequencing and multi-omics, various machine learning techniques have been increasingly applied as powerful tools to provide diverse analyzations and predictions on genomic, proteomic and metabolic data. To construct a QS repository of human gut microbiota, we developed a pipeline including QS training, QS expanding, and QS mining modules and combining basic local alignment search tool (BLAST) and amino acid sequence descriptors, extracting for various QS relevant proteins illustrated in Figure 1. In the QS training module, we have manually collected the positive and negative samples, and trained the data with three different machine learning algorithms to expand QS systems. In the QS expanding module, we did an evolutionary analysis of as many QS related proteins as possible to propose a possible cluster rules for positive samples collection with the help of MEGA X and iTOL. Note that the evolutionary history was inferred using the Neighbor-Joining method. The percentage of replicate trees in which the associated taxa clustered together in the bootstrap test (1000 replicates) are shown next to the branches. The tree is drawn to scale, with branch lengths in the same units as those of the evolutionary distances used to infer the phylogenetic tree. The evolutionary distances were computed using the Poisson correction method and are in the units of the number of amino acid substitutions per site. Local BLASTP method was applied to expand the potential QS systems based on the amino acid sequences. In the QS mining module, QS proteins that had not previously been discovered and annotated were mined and sorted out. The details for the methods applied in the above three modules are listed as follows.
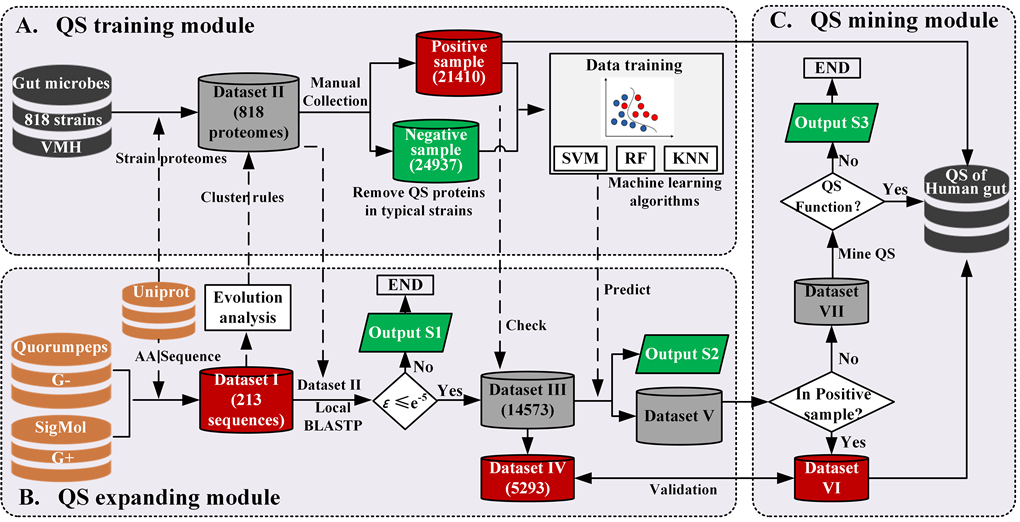
Figure 1. Schematic diagram of the pipeline for constructing a QS repository of human gut microbiota.
In this study, the information of amino acids in protein sequences was calculated, and the supervised machine learning algorithms of support vector machine (SVM), random forest (RF), and k-nearest neighbor (KNN) were used for training and recognition of the carefully curated positive and negative samples to develop different ensemble classifiers. We calculated the frequency of each amino acid type in each QS related protein sequence. The frequencies of all 20 natural amino acids are the percent of the number of amino acid type divided by the length of a protein sequence.
RESULT
1. Collection and evolutionary analysis for validated QS proteins
We collected the 84 AI synthases and 129 QS receptors from SigMol and Quorumpeps database, and curated their corresponding amino acid sequences from Uniprot database. For AI synthases, we can divide them into seven types, i.e., AHL, DSFs, AI-2, indole, HAQs, CAI-1, and Others. Among them, AHL synthases account for the vast majority, which can be divided into three protein families, such as LuxI (from Vibrio fischeri) and YenI (from Yersinia enterocolitica). For receptors, we can also divide them into seven types, i.e., LuxR type, two-component system (TCS) type, CAI-1 receptor, AI-2 receptor, DSFs receptor, HAQs receptor, and other receptors (Figure 2). LuxR type and TCS type receptors account for the vast majority. Similarly, LuxR type sensors can be roughly divided into two protein families, such as LuxR (from Vibrio fischeri) and YenR (from Yersinia enterocolitica). There are more detailed classification and typical QS proteins in Figure S1. In addition, we noted that the evolutionary trees of AHL synthases and their receptors counterpart are in a high similarity, which indicates that there is a coevolution for AHL synthases and their corresponding receptors.
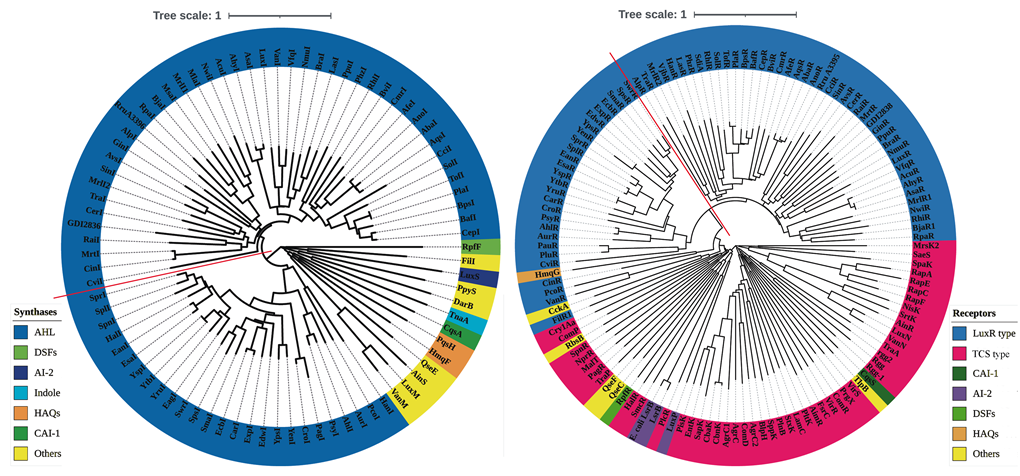
Figure 2. Evolutionary relationships of QS synthases (A) and receptors (B).
2. Results of the annotation-based QS proteins
As illustrated in Figure 3A, we searched and collected the reported QS proteins for each of the 818 gut microbes based on four types of the protein annotation, i.e., quorum sensing (1,640), LuxR (5,921), two-component (15,703), and tryptophanase (66). Take the seven-strain simplified human microbiomes (SIHUMIs) used by Colosimo et al as an example, we also show QS proteins distribution for each strain (Figure 3B). It indicates that LuxR type and TCS type QS proteins account for the vast majority. Furtherly, we note that there is certain overlap in the distribution of these proteins. For example, there are 10, 22, 53, 1 hits for protein annotations of quorum sensing, LuxR, two-component, and tryptophanase, respectively in the E. coli O157:H7 (Figure 3C). There are seven LuxR type QS proteins (P69409, P0ACZ6, P0AGA8, P66798, P0AF30, P0AEL9, and Q8XE66) which are also the components of TCS, which means the potential crosstalk of AHL type and TCS QS systems. In addition, we found that the total count of QS proteins less than 60 accounted for about 90% strains, only seven strains have more than 150 QS proteins (Figure 3D). Therefore, a large proportion of the QS proteins in gut microbes have not been mined and annotated to date, which is much essential for the deciphering of the complex microbe-host interactions.
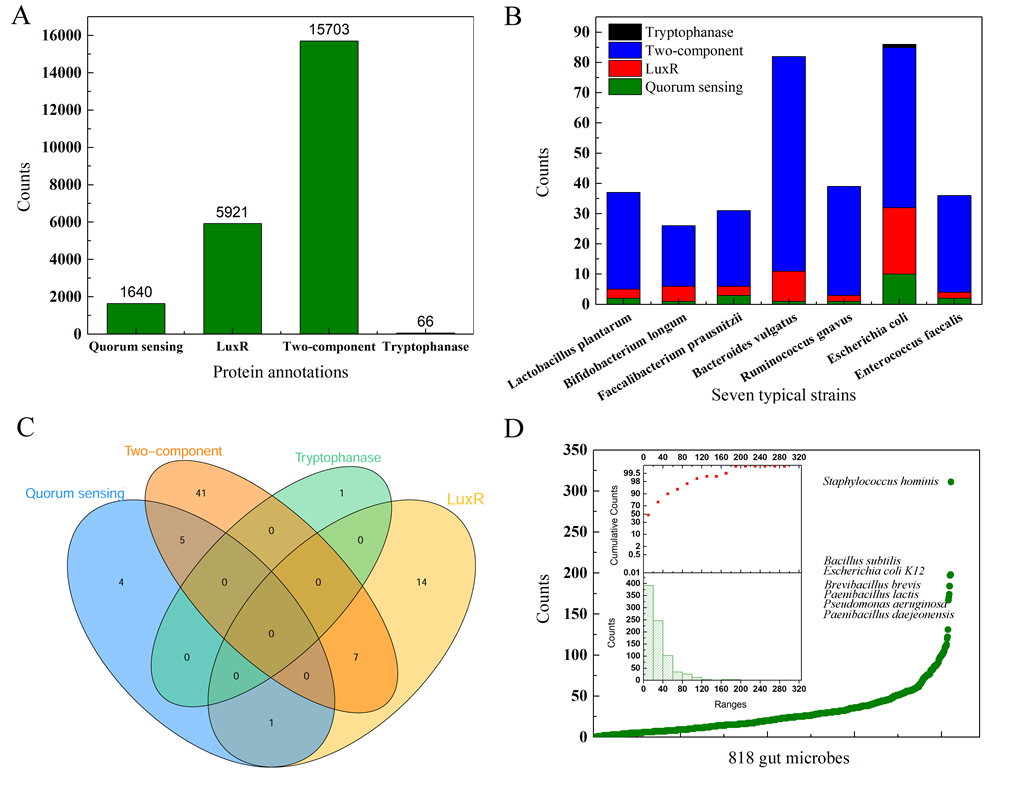
Figure 3. Collections of the reported QS proteins based on four protein annotations.
3. Results of the expanded QS proteins
We enumerated the data scales of different datasets corresponding to four different classifiers. We found that 5,293 sequences (Dataset IV) of 14,573 sequences (Dataset III) obtained by BLASTP were also positive samples. Based on SVM, KNN, and RF classifiers, we obtained 10,244, 10,135, and 10,246 (Dataset V) positive sequences, of which 4,684, 5,015 and 5,293 (Dataset VI) positive sequences were also positive sequences, respectively. It indicates the cover rates of the positive samples for SVM, KNN, and RF classifiers are 0.885, 0.947 and 0.999 (Figure 4A). Then, the classifier based on the SVM trained with the positive and negative samples we constructed achieves the highest positive samples cover rate followed by KNN and SVM classifier. Furtherly, there are more QS proteins in the dataset VII which was expanded based on the BLASTP tools. The predicted sequences can be divided into four types, i.e. Not QS, synthases, regulators, and uncharacterized proteins. QS regulators account for the vast majority, followed by the QS synthases (Figure 4B). Combined with the prediction results of the QS synthases and regulators, we can get the prediction accuracies of the SVM, KNN, and RF classifiers, which are 93.97%, 91.92% and 94.73% respectively. Note that there are 534 sequences that were annotated as uncharacterized proteins. We conducted further manual analysis and comparison of these sequences one by one, and searched for their corresponding properties in the Uniprot protein database. In general, these proteins can be grouped into nine clusters as listed in Figure 4C. There are 28 sequences that are vaguely described without specific protein annotations. Therefore, combined with the annotation-based collections of QS proteins and the expanded QS proteins developed by BLASTP tools, we established a comprehensive QS database for human gut microbiota. The repertoire of QS proteins contained as many proteins related to QS systems of various gut microbes as possible, thus alleviating the previously uneven distribution of QS proteins to a certain extent (Figure 4D).
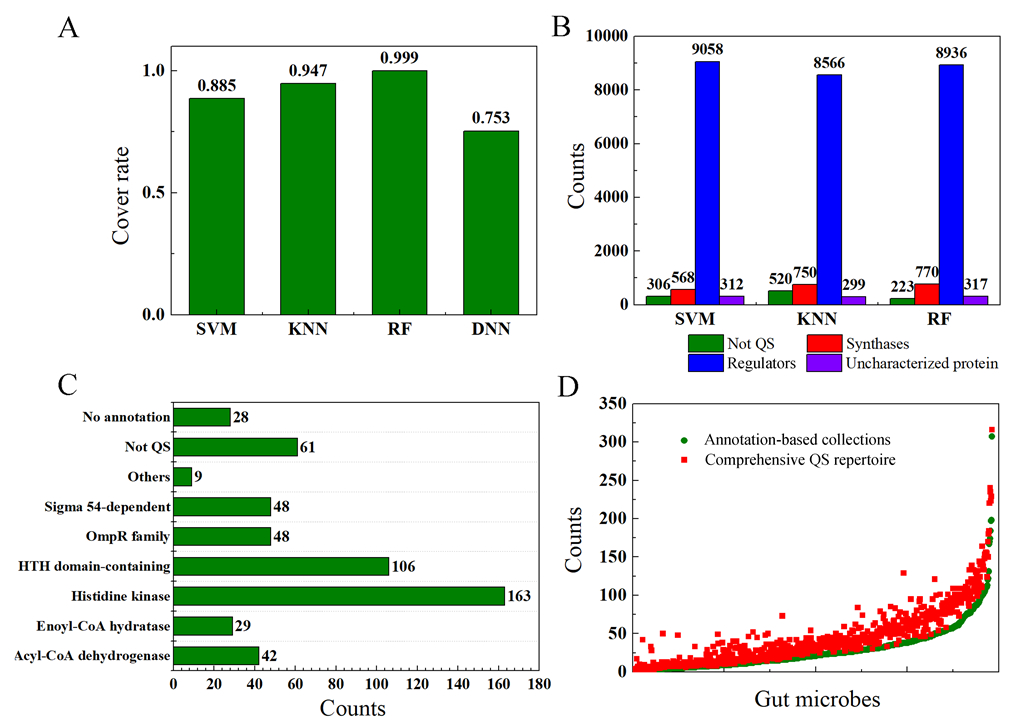
Figure 4. Results and comparative analysis for different classifiers.